

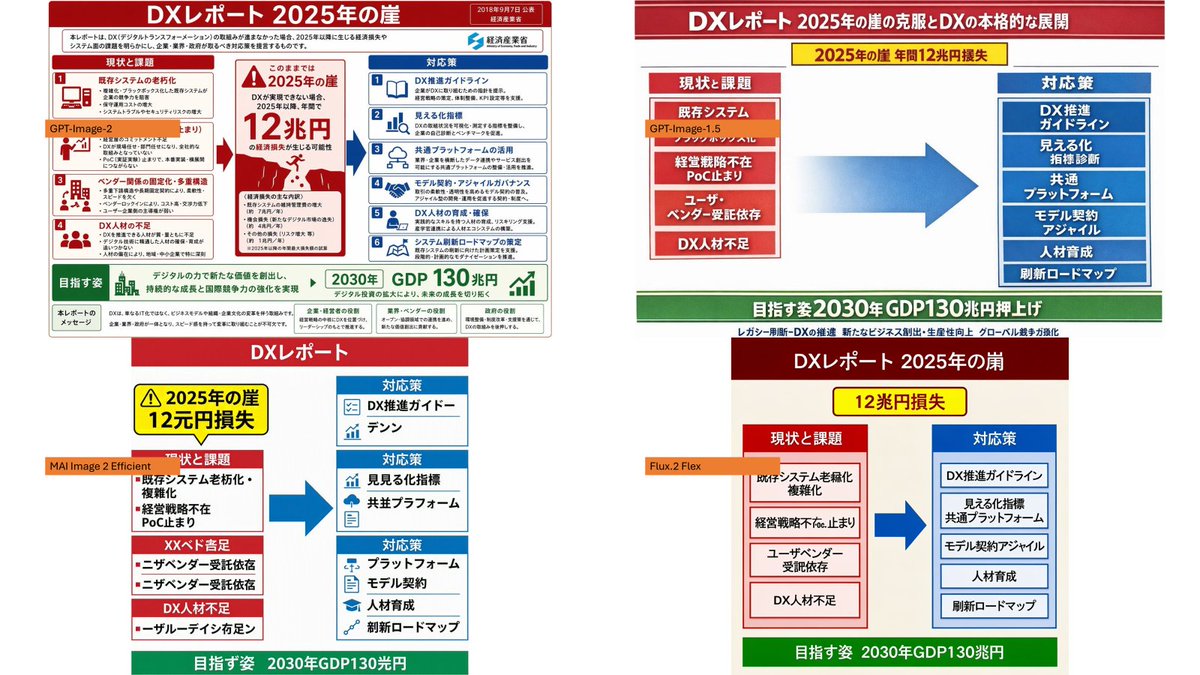
Using the provided reference image as the source infographic, create a 16:9 white-background comparison collage showing how different image models reproduce the same Japanese DX Report infographic.

Layout: Arrange exactly 4 discrete panels in a 2×2-style collage: top-left, top-right, bottom-left, bottom-right. Keep generous white spacing between panels.

Panels:
1. Top-left: show a mostly faithful smaller copy of the reference infographic, preserving the dense Japanese text, red/blue/green government-report layout, central “2025 cliff / 12 trillion yen loss” warning, left-side issues, right-side countermeasures, and bottom 2030 GDP goal. Add an orange label reading [top left model label] over the left-middle area.
2. Top-right: create a cleaner simplified ponchi-e style version of the same content with a red title bar, a yellow warning strip, a red stacked “current issues” box on the left, a large blue arrow in the center, a blue stacked “countermeasures” box on the right, and a green goal bar at the bottom. Add an orange label reading [top right model label] near the left issue box.
3. Bottom-left: create a more distorted simplified vertical version with a red “DX Report” header, yellow warning box, red issue blocks on the left, blue countermeasure boxes on the right, a large blue arrow, and green bottom goal bar. Add an orange label reading [bottom left model label] across the left side.
4. Bottom-right: create a simplified beige-background version with a dark red header, yellow “12 trillion yen loss” warning, red issue column, blue countermeasure column, large blue arrow, and green bottom goal bar. Add an orange label reading [bottom right model label] near the left issue column.

Content to preserve conceptually: the comparison should clearly reference [report topic], with the same core flow from current problems to countermeasures and the 2030 GDP growth target. Make the top-left panel the most accurate and dense; make the other three panels visibly more simplified and less text-faithful, as a model-comparison visual.

Constraints: Use exactly 4 panels and exactly 4 orange model labels. Keep the Japanese infographic style readable where possible, with no extra watermark or unrelated objects.


0 Comments
👥 Co-learning Circle 0
Observe other members' variables & configurations, and click "Study & Retry" to instantly import settings and practice!