

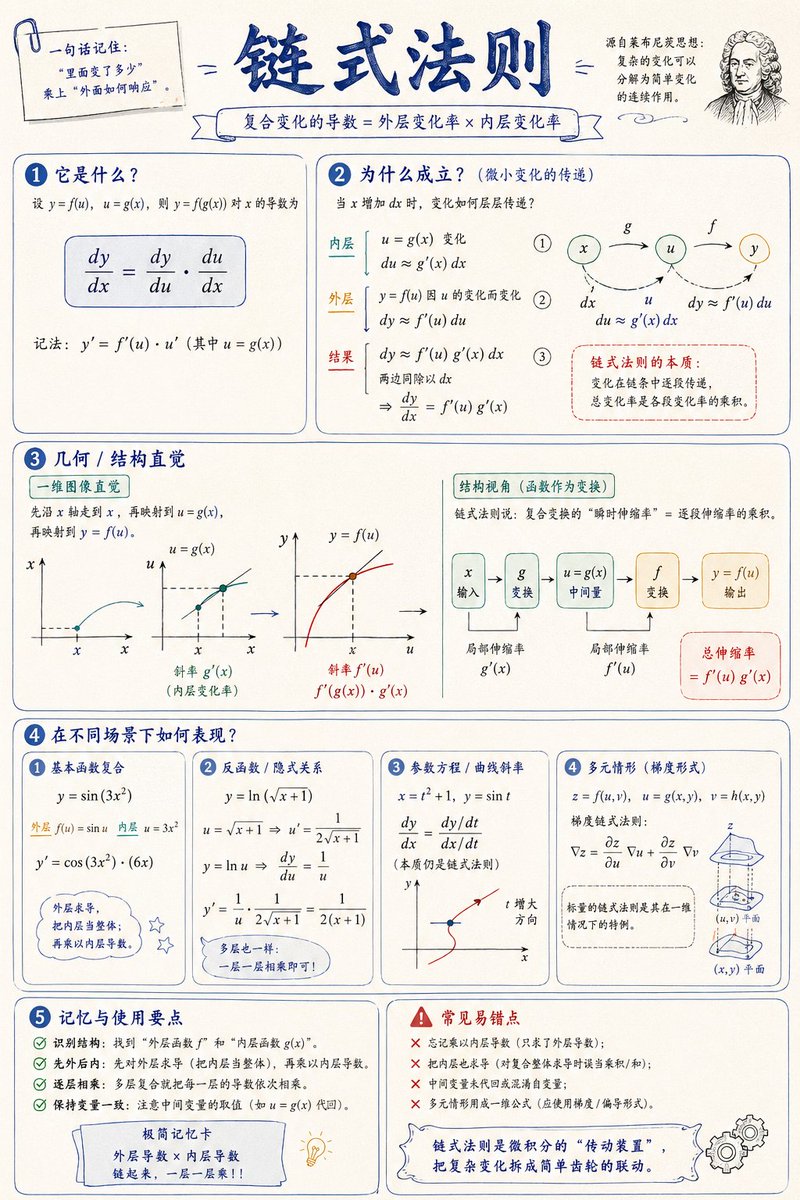
Please create a mathematical visualization infographic about "[topic]" to help readers intuitively understand: what it is, why it holds true, the geometric/structural intuition, and how it behaves in different scenarios. The image should look like a high-quality math lecture handout + hand-drawn educational poster—elegant, clear, and informative without being cluttered. Visual style: [layout], clean light-colored paper background, dark blue headings, black/dark gray body lines, accented with a few elegant blue, turquoise, gold, and red colors. Use rounded-corner cards, thin borders, numbered labels, hand-drawn arrows, partial magnification boxes, and summary columns. The overall design should be aesthetic, balanced, and academic, allowing one to immediately grasp the "structure" and "reasoning" behind the concept.


0 Comments
👥 Co-learning Circle 0
Observe other members' variables & configurations, and click "Study & Retry" to instantly import settings and practice!