

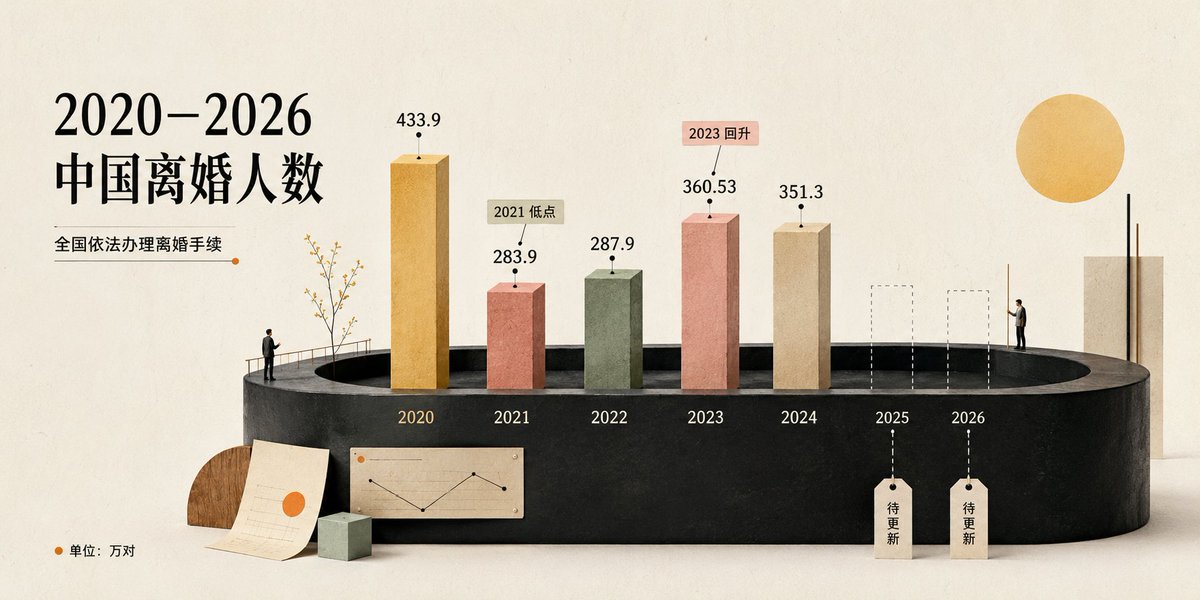
Goal: Create a cream-toned 3D editorial data visualization poster about [headline text], showing divorce counts in China with a refined miniature diorama style.

Canvas: Wide horizontal 2:1 composition, warm off-white paper background with subtle grain, soft shadows, minimalist premium infographic aesthetic. Use a muted cream, black, terracotta, sage, ochre, and beige palette.

Layout: Place the main title on the upper left in large elegant black serif Chinese typography. Under it, add the subtitle [subtitle text] with a thin horizontal rule ending in a small orange dot. The central focus is a black oval/cylindrical stage platform spanning the lower middle of the image, viewed in slight perspective. On the platform, arrange exactly 7 year positions from left to right: 2020, 2021, 2022, 2023, 2024, 2025, 2026.

Data bars: Show exactly 5 solid rectangular 3D vertical bars for years 2020–2024 and exactly 2 dashed-outline placeholder bars for 2025 and 2026. Use these visible values and labels: 2020 ochre-gold tall bar labeled 433.9; 2021 terracotta bar labeled 283.9 with a small callout tag reading “2021 低点”; 2022 muted sage-green bar labeled 287.9; 2023 salmon-pink bar labeled 360.53 with a small callout tag reading “2023 回升”; 2024 beige bar labeled 351.3; 2025 dashed empty bar with a hanging tag reading “待更新”; 2026 dashed empty bar with a hanging tag reading “待更新”. Put each year label in white or pale text along the front face of the black platform beneath its position.

Supporting visual elements: Include exactly 2 miniature human figures: one standing near the left side of the stage railing looking toward the chart, and one standing on the right side near the 2026 area. Include a delicate small tree with thin branches near the 2020 bar. Add one large warm yellow sun circle in the upper right. Add a tall cream rectangular architectural block at the far right behind the platform. At the lower left foreground, add exactly 3 desk-like props: one semicircular wood block, one off-white paper sheet with faint chart lines and an orange dot, and one small pale green cube. On the front lower center of the platform, add one small beige inset chart card showing a simple black line chart with an orange dot.

Legend and text: In the bottom-left corner, add an orange dot followed by “单位:万对”. Keep all Chinese text crisp and readable. Use the data source/style as a polished social-media infographic, not a scientific chart.

Style constraints: Soft natural lighting, realistic paper and plaster textures, subtle 3D depth, clean negative space, no watermark, no extra years, no extra bars, no additional text beyond the specified labels. Use [background color] as the overall background tone and [accent color] for dots and highlights.


0 Comments
👥 Co-learning Circle 0
Observe other members' variables & configurations, and click "Study & Retry" to instantly import settings and practice!