

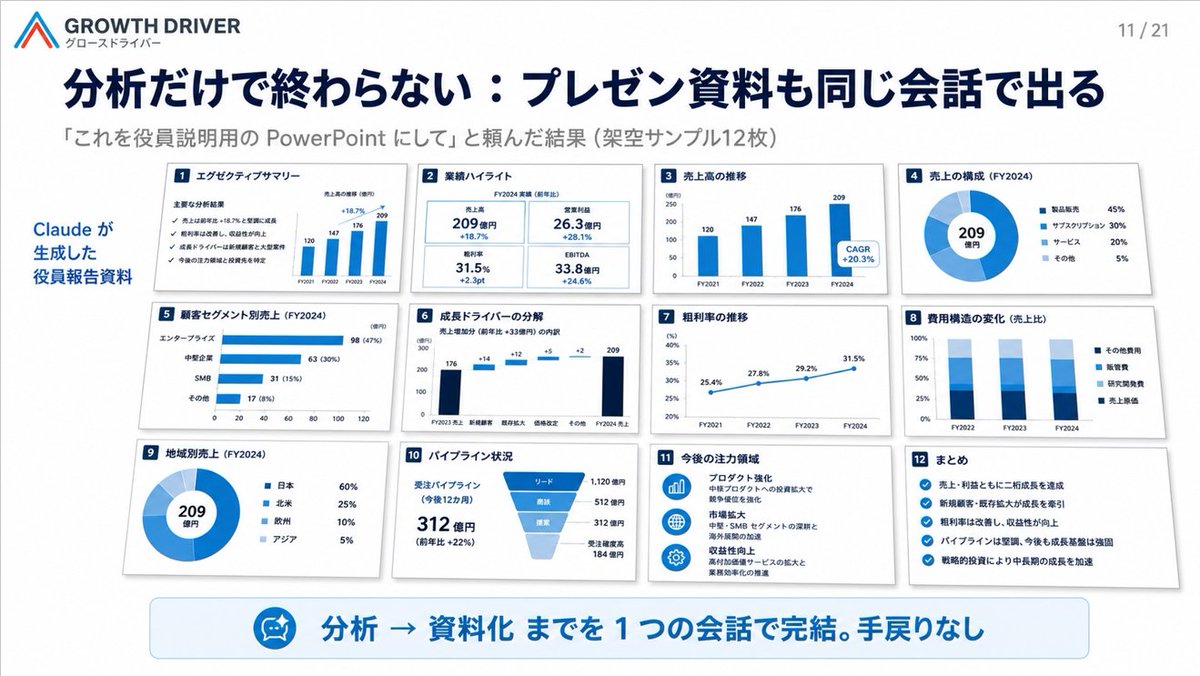
Goal: Create a clean Japanese corporate presentation slide for [company name], showing that an AI tool can convert analysis into board/executive PowerPoint materials in one conversation.

Canvas: 16:9 widescreen slide, white background, polished consulting-deck style with navy and bright blue accents, subtle shadows, precise grid alignment, crisp vector charts, realistic miniature slide thumbnails.

Header: Top left contains a simple angular red-and-blue logo mark, the brand text “GROWTH DRIVER” and small Japanese subtitle “グロースドライバー”. Top right shows page number “11 / 21”. Large bold navy Japanese headline: [headline text]. Under it, smaller gray subheading: [subheading text].

Layout: Left side has a vertical blue annotation reading “Claude が生成した 役員報告資料”. The main area contains exactly 12 small white slide cards arranged in a 4-column by 3-row grid, each with a small navy numbered square in the top-left corner, a Japanese title, chart content, and light gray drop shadow. Use consistent blue chart styling and dense but readable board-report visuals.

The 12 slide cards, counted and labeled exactly:
1. “エグゼクティブサマリー” — checklist-style executive summary with four checkmarks and a tiny bar chart showing FY2021–FY2024 values 120, 147, 176, 209.
2. “業績ハイライト” — four KPI tiles: 売上高 209億円 +18.7%, 営業利益 26.3億円 +28.1%, 粗利率 31.5% +2.3pt, EBITDA 33.8億円 +24.6%.
3. “売上高の推移” — blue vertical bar chart FY2021 120, FY2022 147, FY2023 176, FY2024 209, with a callout “CAGR +20.3%”.
4. “売上の構成(FY2024)” — donut chart with center “209 億円” and legend: 製品販売 45%, サブスクリプション 30%, サービス 20%, その他 5%.
5. “顧客セグメント別売上(FY2024)” — horizontal bar chart: エンタープライズ 98 (47%), 中堅企業 63 (30%), SMB 31 (15%), その他 17 (8%).
6. “成長ドライバーの分解” — waterfall chart from FY2023売上 176 through increments +14, +12, +5, +2 to FY2024売上 209.
7. “粗利率の推移” — line chart from FY2021 25.4%, FY2022 27.8%, FY2023 29.2%, FY2024 31.5%.
8. “費用構造の変化(売上比)” — stacked column chart for FY2022, FY2023, FY2024 with legend: その他費用, 販管費, 研究開発費, 売上原価.
9. “地域別売上(FY2024)” — donut chart with center “209 億円” and legend: 日本 60%, 北米 25%, 欧州 10%, アジア 5%.
10. “パイプライン状況” — funnel chart plus text: 受注パイプライン(今後12カ月)312億円(前年比 +22%), stages リード 1,120億円, 商談 512億円, 提案 312億円, 受注確度高 184億円.
11. “今後の注力領域” — three blue circular icons with short Japanese strategy notes: プロダクト強化, 市場拡大, 収益性向上.
12. “まとめ” — checklist with five blue check icons summarizing growth, new customers, margin improvement, strong pipeline, and strategic investment.

Bottom callout: A wide rounded pale-blue banner spans the lower slide. On the left of the banner is a small circular blue icon resembling an AI assistant/robot face. Large bold blue Japanese text reads: [bottom message].

Visual style: Executive SaaS/consulting presentation aesthetic, minimal, high information density, strong hierarchy, navy typography, white cards, blue charts, subtle gray borders and shadows. Keep all 12 cards visible and evenly spaced. No people, no photos, no decorative clutter, no watermark.


0 Comments
👥 Co-learning Circle 0
Observe other members' variables & configurations, and click "Study & Retry" to instantly import settings and practice!