

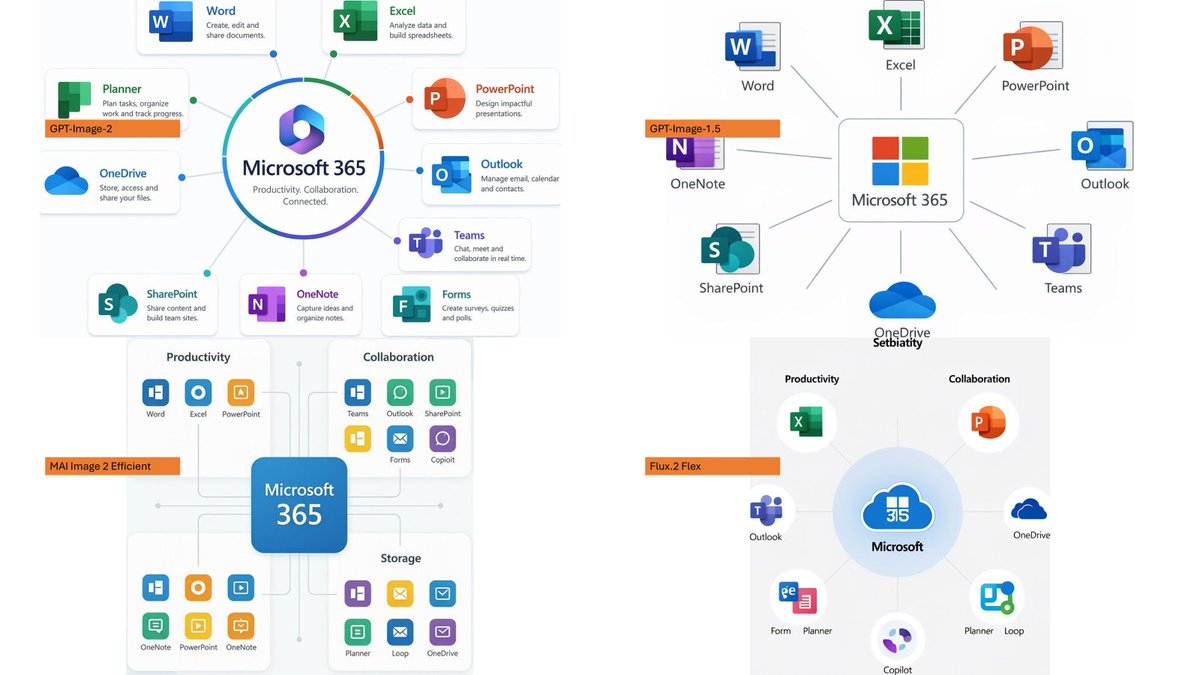
Using the provided reference image as a rough inspiration for an official explanatory slide/infographic, create a clean comparison image showing the same Microsoft 365 ecosystem concept generated in four different model styles.

Canvas and layout: 16:9 white slide, divided into exactly 4 quadrants in a 2×2 grid with generous whitespace and no hard divider lines.

Subject: Each quadrant should show a Microsoft 365 hub-and-spoke or app ecosystem diagram centered on [main product name], with surrounding Microsoft app icons and short English labels.

Quadrants and visible orange model tags: Include exactly 4 orange labels, one per quadrant:
1. Top-left: [first model label] — polished circular Microsoft 365 hub diagram with multiple app cards around it.
2. Top-right: [second model label] — simpler radial hub diagram with icons around a central Microsoft 365 box.
3. Bottom-left: [third model label] — structured dashboard-like diagram with grouped sections such as Productivity, Collaboration, and Storage.
4. Bottom-right: [fourth model label] — soft circular diagram with icons orbiting a central Microsoft cloud-style mark.

Apps to include across the diagrams: Word, Excel, PowerPoint, Outlook, Teams, OneDrive, SharePoint, OneNote, Planner, Forms, Loop, and Copilot where appropriate. Use recognizable Microsoft-style colored app icons, but keep everything as a generated infographic rather than a screenshot.

Style: Modern corporate PowerPoint infographic style, crisp readable English text, flat vector icons, subtle shadows, light gray connector lines, mostly white background, Microsoft blue/green/orange/purple palette. Keep the overall image clean and presentation-ready.


0 Comments
👥 Co-learning Circle 0
Observe other members' variables & configurations, and click "Study & Retry" to instantly import settings and practice!